Advertiser Disclosure: Many of the companies featured here provide compensation to us. This is how we maintain our free service for consumers. Compensation, along with hours of in-depth editorial research, determines where & how companies appear below.
This year’s Pride Month is important for the LGBTQ community, as it marks the first time a president has officially recognized the month since 2016. This year also sees a collective holding of breath among the LGBTQ community as they wait to see what progress will be made regarding equality and acceptance.
The United States Supreme Court is expected to rule soon on the case of Fulton vs. Philadelphia, which could have significant implications for healthcare access for LGBTQ individuals.
Same-sex couples in the United States face some disparities compared to heterosexual couples. One area where this is evident is in access to employer-provided healthcare. LGBTQ financial stats also struggle more than heterosexual individuals in other areas, such as financial stability.
In the United States, LGBTQ+ individuals and same-sex couples often face discrimination and disparities in many aspects of life, including their finances. In recognition of Pride Month 2023, we’ve gathered statistics from government agencies and private organizations that paint a picture of the financial health of same-sex couples and LGBTQ+ individuals in the US.
Observations
- A recent study shows same-sex couples earn more money than opposite-sex couples. The average difference was $1,681, with male same-sex couples earning $17,250 more than their counterparts. Female same-sex couples, however, earned $9,643 less than opposite-sex couples.
- While the poverty rate for cisgender heterosexual Americans is 16 percent, it is significantly higher for transgender individuals – 34 percent for trans men and 32 percent for trans women. This disparity is even more pronounced compared to cisgender queer Americans, of which only 22 percent live in poverty.
- One-third of lesbian and bisexual women have experienced a personal financial crisis, such as declaring bankruptcy or being unable to pay bills. This is compared to 24% of straight women, 23% of gay and bisexual men, and 15% of straight men.
- In a survey of non-LGBT and LGBT households, it was found that significantly fewer non-LGBT households would be unable to cover an unexpected $400 expense than LGBT households.
- An increasing number of employers offer spousal benefits to same-sex couples, although the percentage is still relatively low. This limits access to vital benefits for thousands of same-sex couples.
- Although 43% of the general population of the United States feels able to make a wise decision about reducing or paying off personal debt, only 32% of Americans who identify as lesbian, gay, bisexual, transgender, and queer (LGBTQ) feel the same way.
LGBTQ financial Stats

There are relatively little data on LGBTQ financial stats.
There is a lack of data on same-sex couples’ financial health, making it difficult to make informed decisions about policies and programs that impact this group. While some government entities do collect information on sexual orientation and gender identity, it is often not broken down in a way that allows for accurate analysis of the data. This disadvantages employers and policymakers when considering all groups’ needs.
In the future, we hope to see more robust data collection in this area.
Married opposite-sex couples earn $17,250 more than married same-sex couples, but married same-sex couples make $9,643 less
Married heterosexual couples have a median annual income of $96,932, while same-sex couples earn an average of $98,613 per year. The Census Bureau does not specify whether these same-sex couples are unmarried.
Male same-sex couples earn an average of $114,182, which is $17,250 more than opposite-sex couples. Unlike opposite-sex teams, same-sex couples make $87,289 — $9,643 less than opposite-sex couples.
There was a $26,893 difference in earnings between male and female same-sex couples.
Women in same-sex relationships are disproportionately affected by the gender pay gap.
- The cost of marriage between opposite-sex couples is 96,932 dollars
- Couples of opposite sexes who are unmarried pay 72,401 dollars
- Couples of the same sex 98,613 dollars
- Couples with males of the same sex paid 114,182 dollars
- Couples with females of the same sex 87,289 dollars
- The average household income in the United States is 65,712 dollars
A woman who identifies as LBQ earns less than a straight woman, a straight man, or a straight man who identifies as GBQ

There is a significant pay gap between queer women and other groups in America. According to a recent study, only 25% of lesbians earn more than $75,000 annually, compared to 32.2% of gay men 32.
It is well-documented that women, on average, earn less than men. This disparity is even more pronounced between lesbian, bisexual, and queer (LBQ) women and their straight counterparts.
The pay of LBQ women is also affected by their racial and ethnic background. 32% of white LBQ women earn more than $75,000 annually, while only 17% of LBQ women of color make that much.
There is a growing trend of white employees earning more money than their racial-minority counterparts.
Earnings of women over $75,000 annually
- 31% of women are lesbians
- Female bisexuals make up 23%
- Straight women make up 32.5%
Compared to opposite-sex couples, 62% of same-sex couples have both partners working
In 49.4% of married opposite-sex couples, both partners are employed, while in 62.3% of married same-sex couples.
A majority of married male same-sex couples (63.1%) are employed, which may contribute to their earnings more than married heterosexual couples and married female same-sex couples (61.6% of whom have employment).
Both partners in female same-sex couples are about as likely to be employed as male same-sex couples. Women in same-sex couples earn significantly less than their male counterparts and their opposite-sex partners, indicating the amplified gender wealth gap that females in same-sex relationships experience.
Employed couples as a percentage of households

Same-sex male
- 63.1% are married
- 71% of people are unmarried
Same-sex females
- 61.6% of people are married
- 67.2% are unmarried
Same-sex couples
- 62.3% are married
- 69% are unmarried
Those of the opposite sex
- 49.4% are married
- 64.3% are unmarried
In 2016, LGBT Americans struggled financially or couldn’t meet their expenses compared to the general population
According to a 2016 study, 41% of LGBT Americans reported experiencing financial difficulties or inability to keep up with their bills. This is compared to 27% of the general population (about 6% of whom identified as LGBT). Financial difficulties can have a range of impacts on people’s lives, from causing stress and anxiety to leading to homelessness.
The financial situation of LGBT Americans has improved in recent years, with the percentage reporting being in the best financial situation growing from 2% in 2012 to 15% in 2016. This is nearly on par with the general population.
LGBT Americans, however, reported in 2016 that they were making ends meet but were having difficulty keeping up with expenses compared to 2012.
It is generally accepted that the LGBT population faces more difficulties than the general population. This may be due to various factors, such as disparities in financial education, employer benefits, and geography.
The number of LBQ women and GBQ men who have experienced a serious financial crisis is higher than the number of straight men and women
One-third of LBQ women have suffered from a significant financial crisis, compared to 24% of straight women, 23% of GBQ men, and 15% of straight men.
There is no definitive answer as to what caused the financial crisis, but there is evidence to suggest that it may be related to income inequality among groups. LGBTQ Americans, for example, tend to make less money than their cis-straight counterparts and are less likely to have health or life insurance. This could create a perfect storm, leading to financial instability for many in the LGBTQ community.
There is a lack of preparedness among LGBT Americans for future crises as well

The LGBT community is disadvantaged when preparing for future emergencies compared to non-LGBT Americans. This is according to the Center for LGBT Economic Advancement & Research (CLEAR).
According to the survey, 10% of non-LGBT households would be unable to cover an unexpected $400 expense, whereas 14.5% of LGBT households would be unable to do so.
In addition, 36% of LGBT households would not be able to cover three months’ worth of expenses without borrowing, saving, or selling assets, compared to 25% of non-LGBT households.
The level of debt among LGBT Americans is fairly equal with that of the general population
Although LGBT people are more likely to struggle financially, they have similar debt levels to the general public.
The fact that large debt can lead to financial and mental health problems is a bright spot in this report.
Despite the common misconception, LGBTQ women do not earn significantly more than their cis-straight counterparts. There is a significant income disparity between the two groups, which could lead to debt problems for LGBTQ women.
LGBT Americans live in poverty at a rate of 22%, compared to 16% for straight cisgender people
Cis-straight Americans have a poverty rate of fifteen point seven percent, while LGBT Americans have a poverty rate of twenty-one point six percent. The transgender population has an even higher poverty rate at twenty-nine point four percent.
According to data, there is a financial well-being gap for LBQ women when compared to cisgender men. In general, women experience higher poverty rates than men do in America. However, transgender Americans and cis-bisexual women have the highest poverty rates of any group.
Based on sexual orientation and gender identity, the poverty rate differs

- Trans men 33.7%
- Trans women 29.6%
- Cis-bisexual women 29.4
- Transgender men and women 29.4
- Gender nonconforming 23.8
- All LGBT men and women 21.6
- Cis-bisexual men 19.5%
- Cis-lesbian women 17.9%
- Cis-straight women 17.8%
- Cis-straight men and women 15.7%
- Cis-straight men 13.4%
- Cis-gay men 12.1%
This may be influenced by geography.
Large cities that are more open and welcoming to the LGBT community are often where same-sex couples and LGBT individuals choose to live. These places, like San Francisco, Portland, Austin, and Washington D.C., have a higher density of LGBT residents and tend to be more socially conscious than other cities. However, they also come with a higher cost of living.
Poverty is a complex issue often measured by national standards that don’t consider the cost of living in specific cities. For example, a salary thought a poverty level in Omaha might not provide the same purchasing power in San Francisco.
Poverty rates among LGBT racial minorities are significantly higher than among white LGBT Americans.
Compared to their cisgender, straight, same-race counterparts, LGBT racial minorities experience higher poverty rates.
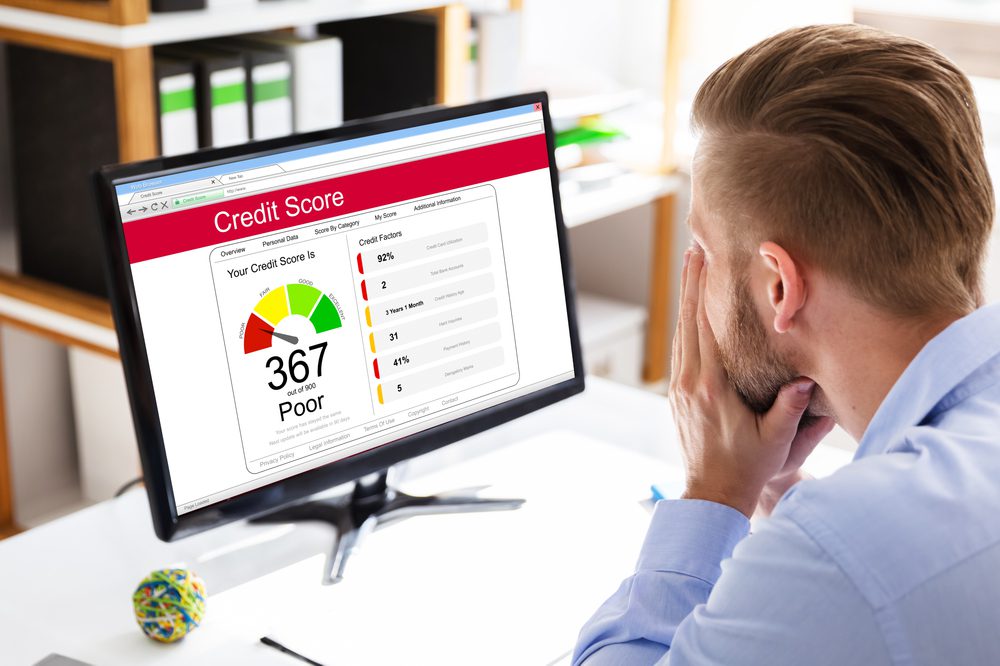
It is almost twice as likely for LGBT Americans to have “poor” or “very poor” credit as non-LGBT Americans
There is a significant disparity in credit scores between LGBT and non-LGBT Americans, with 16% of LGBT respondents reporting a “poor” or “very poor” score compared to just 8% of non-LGBT respondents.
A good credit score is essential for accessing many of the best financial products on the market, from credit cards to mortgages. This problem can quickly become a self-perpetuating cycle for those who don’t have a good credit score.
Credit scores that are “poor” or “very poor”

Female
- 20.70% of the population is LGBT
- 9.80% were non-LGBT
Male
- 12.30% are LGBT
- 6.60% non-LGBT
Black
- Approximately 31.30% are LGBT
- The percentage of non-LGBT individuals is 17.10%
Hispanic
- 18.80% of the population are LGBT
- 12.30% are non-LGBT
White
- 13.00% are LGBT
- 6.40% are non-LGBT
Employers who offer spousal benefits to same-sex spouses are only 74% of the time
Approximately 95% of employers offer health insurance to employees’ spouses, but coverage for same-sex spouses is lacking.
In 2020, only 74% of employers offered same-sex spousal health benefits (up from 43% in 2016).
Without insurance, healthcare can be expensive. A single medical bill can undo years of financial planning. To achieve financial stability, it is imperative to be able to obtain health insurance.
More and more employers are offering same-sex spousal benefits to their employees, with 91% of employees having access to these benefits in 2017 (up from 84% in 2016).
It is less likely that smaller employers will offer spousal benefits to same-sex spouses. Most employers with 1,000 or more employees provided spousal benefits to same-sex spouses, compared to 73% of employers with 3–49 employees.
Numerous factors affect whether a household has access to health insurance. One of the most important factors is whether the head of the household’s employer provides health insurance. This may help explain why LGBT households are less likely to have healthcare insurance coverage.
No-insurance adults
Female
- LGBT are 11.30%
- Non LGBT are 7.00%
Male
- LGBT are 9.40%
- Non-LGBT are 6.30%
Black
- LGBT are 17.20%
- Non-LGBT are 10.30%
Hispanic
- LGBT are 17.10%
- Non-LGBT are 11.90%
White
- LGBT are 7.10%
- Non-LGBT are 5.20%
Over a quarter of LGBT households are unbanked or underbanked
Almost one in five (23%) LGBT households are unbanked or underbanked, compared to 18% of non-LGBT households.
(According to CLEAR, “unbanked” means a household does not have a checking account, savings account, or money market account; “underbanked” means the household has at least one bank account but has used alternative financial services in the past year.)
Populations without or underbanked
Female
- LGBT: 9.70%
- Non-LGBT: 4.40%
Male
- LGBT: 3.20%
- Non-LGBT: 3.20%
Black
- LGBT: 14.10%
- Non-LGBT: 10.00%
Hispanic
- LGBT: 11.10%
- Non-LGBT: 6.60%
White
- LGBT: 3.80%
- Non-LGBT: 2.30%
LGBT Americans are less likely to use financial products than the general population
According to a Prudential survey conducted in 2016, 47% of the general American population maintains a savings account, while only 40% of LGBT Americans do so.
The building blocks of financial well-being are brokerage accounts, savings accounts, retirement accounts, and insurance products. Almost every financial product listed had lower usage rates among LGBT Americans.
Compared to the general population, LGBT Americans invest less than 5% of their income in retirement and growth accounts
As of 2016, LGBT Americans spent 20% of their income on retirement, growth accounts, or accounts with quick access, while the general population spent 25%.
The fact that LGBT Americans and the general population have been able to put more money toward retirement, investments, and other accounts than into debt, loans, or discretionary spending is a positive development.
LGBT Americans and the general population want to increase their investment in these accounts, a desire we support. To be financially healthy, you must invest for the long term and stay the course.
Total household savings are affected by the disparity in growth account contributions. According to CLEAR’s 2021 report, non-LGBT households are more likely to have saved $50,000 or more than LGBT households.
Savings total for the household

<$50k
- LGBT: 55.20%
- Non-LGBT: 11.90%
$50k–$99k
- LGBT: 8.80%
- Non-LGBT: 3.20%
$100k–$249k
- LGBT: 14.10%
- non LGBT: 10.00%
$250k–$499k
- LGBT: 9.70%
- Non-LGBT: 12.80%
$500k–$1M
- LGBT: 6.70%
- Non-LGBT: 9.10%
$1M+
- LGBT: 7.00%
- Non-LGBT: 7.10%
Financial choices are more difficult for LGBT Americans than for other Americans
LGBT Americans are far less likely than the general population to feel prepared to make financial decisions related to important issues, according to a new study.
Only 24% of LGBT respondents said they felt confident in their ability to make wise choices about money, compared to 34% of the overall population.
According to Prudential’s data, most Americans are not prepared to make wise financial decisions. In all areas, LGBT Americans felt less ready to make the best decision than the general population.
Why do LGBT Americans feel less prepared than the general population? According to Lee Badgett, Professor of Economics at UMass-Amherst and author of The Economic Case for LGBT Equality: Why Fair and Equal Treatment Benefits Us All, LGBT people are younger and may not have the same assets, incomes, and knowledge as heterosexuals.
According to Badgett, the research suggests that financial education targeted at LGBT individuals is necessary. In addition to general types of financial education, LGBT people may benefit from programs that acknowledge and empower them to recognize unfair treatment in the labor market and on the credit market.
It is also possible that the LGBTQ population feels less prepared due to factors such as not being able to obtain health insurance for their same-sex spouse, lower annual income, and uncertainty about issues such as life insurance.
In comparison to LBQ women and GBQ men, about 70% of straight men and women own homes
Consumer Financial Protection Bureau research shows that homeownership is associated (but not causally linked) with stronger financial well-being.
The gap between straight and LGBT Americans in homeownership persists, unfortunately.
Gender and sexual orientation differences in living arrangements
Own
- 60.10 % of LBQ women
- The percentage of straight women is 69.10%
- GBQ men 59.80%
- Straight men, 70.20%
Rent
- LBQ women 32.50%
- Straight women 25.10%
- GBQ men 32.80%
- Straight men, 23.80%
Alternative arrangements
- LBQ women 7.40%
- Straight women, 5.70%
- GBQ men 7.30%
- Straight men 6.00%
There is no data on why homeownership is lower among LGBTQ Americans. Still, Professor Badgett references “recent studies that show same-sex couples experience discrimination in the credit market for mortgages.”
As we all know, housing is costly in cities with a large LGBTQ population. Some cities, including San Francisco and Washington, D.C., have significantly higher housing prices than others, making it more difficult for people to purchase homes there.
The LGBTQ finance sector still has a long way to go despite improvements
From the data that is currently available, it appears that same-sex couples and LGBT Americans are more likely to experience financial difficulties – such as poverty, personal financial crisis, or difficulty paying bills – than opposite-sex couples and straight Americans. This is a significant issue that needs to be addressed to ensure equality for all citizens.
There are disparities within the LGBT population regarding things like income and poverty rates, which factors like race and gender can amplify. For example, male same-sex couples tend to have higher incomes than other types of couples (both same-sex and opposite-sex), while female same-sex couples have the lowest incomes. Additionally, white LBQ women generally face lower poverty rates than LBQ women of color.
Although LGBT Americans may lag behind the general population in financial literacy or utilizing certain financial tools, the data shows that there is still room for improvement in both areas. Financial education can help to build confidence in making sound financial decisions while using various financial products can help people to reach their goals more effectively.
Despite some challenges, the LGBT community has made significant progress in recent years. In particular, the percentage of LGBT Americans who reported a higher level of financial freedom grew from 2012 to 2016 and is now nearly on par with the general population. Additionally, LGBT Americans don’t carry higher levels of debt than the general population and have aspirations to invest and save more. This progress is encouraging, and it provides hope for continued improvement in the future.


